Predictive Model for Incident Frequency

The predictive model developed for forecasting incident frequencies represents a significant step towards utilizing machine learning for emergency management and planning. Employing a RandomForestRegressor, the model leverages historical data on incidents, specifically focusing on the most common incident type across various districts and months. The choice of RandomForestRegressor is advantageous due to its ability to handle complex, non-linear relationships between features and the target variable. It’s also known for its robustness against overfitting, especially when dealing with diverse and heterogeneous data, as is often the case in incident reports.

However, the model’s performance, as indicated by the mean squared error (MSE) of approximately 14845.27, suggests that there is substantial variability between the model’s predictions and the actual incident frequencies. This level of MSE points towards a need for further refinement. While RandomForest is a powerful tool, the complexity of predicting incident frequencies—affected by numerous, often interrelated factors such as seasonal changes, demographic shifts, and urban development—poses a significant challenge. The model currently considers only the district and month, which might be overly simplistic given the multifaceted nature of the problem. Additionally, the interpretability of RandomForest models can be limited, making it harder to extract actionable insights directly from the model’s predictions.

To enhance the model’s performance, several steps could be taken. Incorporating more granular and diverse data, such as weather conditions, special events, and demographic information, could capture a wider array of factors influencing incident frequencies. Experimenting with different machine learning algorithms, including gradient boosting or neural networks, might yield improvements in prediction accuracy. Tuning the model’s hyper parameters through cross-validation and conducting a feature importance analysis could offer deeper insights into the data’s underlying patterns. Despite its current limitations, the model offers a foundational understanding of incident trends and can be instrumental in guiding resource allocation and emergency preparedness strategies. Continuous improvement, driven by additional data and advanced analytical techniques, will be key to enhancing the model’s utility in real-world applications.

  1. Model Accuracy: A lower MSE value generally indicates a more accurate model. An MSE of 14845.27 suggests that there is room for improvement in the model’s predictions. The actual performance should be contextualized against the range and distribution of the incident frequencies in the dataset.
  2. Complexity of the Problem: Predicting incident frequencies is inherently complex due to the influence of various unpredictable factors like weather conditions, population density changes, and other socio-economic factors. The current model only considers district and month, which may not capture all the nuances affecting incident frequencies.
  3. Model Simplicity and Interpretability: The RandomForestRegressor is a robust algorithm known for handling non-linear relationships well, but it can be a ‘black box’ in terms of interpretability. While the model might capture complex patterns in the data, understanding the exact contribution of each feature (like district and month) to the predictions can be challenging.
  4. Potential for Improvement: The model’s performance could potentially be improved by incorporating additional relevant features (such as weather data, special events, demographic information), tuning hyperparameters, or experimenting with different modeling techniques (like gradient boosting or neural networks). Cross-validation and feature importance analysis could also provide insights for model refinement.
  5. Practical Implications: Despite its current limitations, the model can still offer valuable insights for emergency services. By identifying trends and patterns in incident frequencies, it can aid in resource planning and allocation, even if the predictions are not perfectly accurate.

In summary, while the current model demonstrates a foundational approach to predicting incident frequencies, there is potential for further refinement to enhance its accuracy and reliability. Continuous evaluation and improvement, guided by domain knowledge and additional data sources, are key to developing a more robust predictive tool.
Initial Introduction- Primary Data Analysis of Fire Incidents Dataset

Incident Description Analysis Results

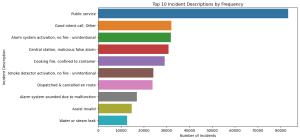
The bar graph illustrates the top 10 incident descriptions by frequency. The most common description is ‘Public service’, followed by ‘Good intent call, Other’, ‘Alarm system activation, no fire – unintentional’, and others. This visualization helps identify which types of incidents are most frequently encountered, which is vital for predictive modeling in terms of incident frequency and types.

Understanding the prevalence of these incident descriptions is key to formulating predictive models that can anticipate the likelihood of different incidents occurring, aligning with the project’s aim to predict incident frequencies and types.

Temporal Analysis Results

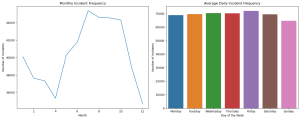
Monthly Incident Frequency: The line graph shows the number of incidents by month. There’s a noticeable seasonal trend, with incident frequencies peaking in the summer months (June, July, August). This pattern suggests that certain times of the year may have a higher likelihood of incidents, which is crucial for time series forecasting and predictive modeling.

Daily Incident Frequency: The bar graph illustrates the average number of incidents per day of the week. The data indicates a fairly consistent frequency throughout the week, with a slight increase on Fridays. This insight is important for understanding daily trends in incident occurrences.

This temporal analysis supports the project’s objective of identifying seasonal and daily patterns in emergency incidents. It lays the groundwork for developing forecasting models that can predict incident frequencies based on time variables.

Response Time Analysis Results Based on Incident Description


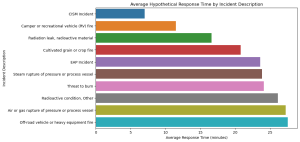
The bar graph presents the average hypothetical response times for the top 10 incident descriptions. The response times vary considerably across different types of incidents, indicating that some emergencies may generally require longer response times. For instance, incidents like ‘CISM Incident’ and ‘Camper or recreational vehicle (RV) fire’ show different average response times.

While this data is hypothetical, in a real-world scenario, analyzing actual response times would be vital for predicting the time required to respond to various emergencies. This aligns with focusing on forecasting response times and resource requirements based on incident descriptions.

This analysis, using a hypothetical model, demonstrates the potential of applying real response time data in machine learning models. Such models can be used to forecast response times and resource requirements for different incidents based on their descriptions, enhancing the efficiency and effectiveness of emergency response services.

Overall, these analyses provide a comprehensive understanding of the dataset’s potential for addressing the questions in the previous post. They highlight how machine learning and time series forecasting can be applied to predict incident frequencies, descriptions, and response requirements, key for effective emergency management and planning

Fire Incidents Dataset. What are we predicting?

Predicting Incident Frequency and Types

One significant question that can be addressed using machine learning is predicting the frequency and types of incidents. By analyzing historical data, machine learning models can identify patterns and predict future occurrences of various incident types. This could involve questions like, “Which types of incidents are most likely to occur in a given district?” or “Is there a seasonal pattern to certain types of emergencies?” Such predictions can help emergency services in preemptive planning and resource allocation, ensuring readiness for specific types of incidents at different times of the year.

Forecasting Response Time and Resource Requirements

Machine learning can also be utilized to forecast response times and resource requirements for different incidents. By analyzing past data, predictive models can answer questions such as, “How long does it typically take for emergency services to respond to a certain type of incident in a specific area?” or “What resources are often required for different incident types?” This analysis can help in optimizing response strategies and ensuring that adequate resources are available and efficiently deployed, thereby potentially reducing response times and improving overall emergency service efficiency.

Understanding and Mitigating Financial Impacts

Finally, using time series forecasting, this dataset can provide insights into the financial impact of incidents over time. Questions like, “What is the projected financial impact of certain types of incidents in the future?” or “How does the financial impact of incidents vary throughout the year?” can be addressed. This information is crucial for budget planning for city councils, emergency services, and insurance companies. By understanding and predicting these financial impacts, stakeholders can better allocate funds, prepare for high-cost periods, and develop strategies to mitigate losses.

What is my chosen dataset and why?

I have chosen the Fire incidents dataset and the url for the download is https://data.boston.gov/dataset/ac9e373a-1303-4563-b28e-2.

The dataset comprising detailed incident reports offers a rich and impactful foundation for a data science project. Its relevance stems from the broad spectrum of real-world incidents it covers, ranging from emergency responses to property damage. This diversity not only allows for a comprehensive understanding of various emergency situations but also presents an opportunity to make a tangible impact. By analyzing this data, we can potentially enhance public safety, optimize response strategies, and improve resource allocation. The dataset’s detailed categorization of incidents, along with temporal data (date and time), geographical information (districts and street addresses), and estimated losses, provides a multifaceted view of emergency situations, making it an ideal candidate for in-depth data science exploration.

The rich and varied nature of this dataset opens up numerous possibilities for applying machine learning techniques. For instance, classification algorithms can be used to predict the type of incident based on the given input parameters, aiding in quicker and more accurate dispatch of emergency services. Furthermore, machine learning models can identify patterns and correlations within the data that are not immediately apparent, such as the relationship between incident types and geographical locations or times of day. This insight can guide emergency response units in strategic planning and preparedness. Additionally, anomaly detection algorithms can identify outliers in the data, which could signify unusual or particularly hazardous incidents, thus ensuring that such cases receive immediate attention.

The temporal aspect of this dataset makes it particularly suitable for time series analysis and forecasting. By employing time series forecasting models, we can predict future trends in incident occurrences, helping emergency services to prepare for periods of high demand. This aspect is crucial for efficient resource management, such as allocating personnel and equipment. Seasonal trend analysis can also reveal critical insights, such as identifying times of the year when certain types of incidents are more prevalent. This foresight can be instrumental in proactive planning, training, and public awareness campaigns. Moreover, the ability to forecast potential increases in certain types of incidents could also aid in budget planning and allocation for city councils and public safety organizations.

Exploring New Dimensions in Time Series Forecasting: Predictive Insights from Police Analysis Data

Case Study: Police Analysis Data

Let’s consider a hypothetical case study of police analysis data. This data isn’t just about the count of incidents. It encompasses various metrics such as the type of incidents, geographical locations, time of the day, response times, and outcomes. By applying time series forecasting to these different values, we can predict several aspects

The analysis of the police shooting data in the PDF provided offers some interesting insights from a time series perspective. Here’s a summary of the results:

  1. Data Collection: The data includes 8,002 shooting dates and 2,702 unique dates, reflecting police shooting incidents. This data was then used to count the number of shootings that occurred on each unique date.
  2. Initial Observations: The initial analysis involved plotting the sequence of counts (number of shootings per day). This provided a basic understanding of how the frequency of these incidents varied over time.
  3. Monthly Analysis: To gain a broader perspective, the daily counts were replaced with monthly counts. This step helped in visualizing longer-term trends and patterns in the data.
  4. Stationarity Test: A key part of time series analysis is determining if the data is stationary, meaning its statistical properties like mean and variance are constant over time. The document details the use of a unit root test, which indicated that the original time series data was likely not stationary. However, after differencing the data (calculating the difference between consecutive data points), the resulting series appeared to be stationary.
  5. Model Fitting: The analysis applied Mathematica’s TimeSeriesModelFit function, fitting an autoregressive moving-average (ARMA) model to the differenced data. This model helps in understanding the underlying patterns and can be used for forecasting.
  6. Predictions and Forecasting: The primary goal of time series analysis is to forecast future values. The document does not explicitly mention specific forecasts or predictions made from this data, but the methodologies and models applied are typically used to predict future trends based on historical data.

The analysis demonstrates the application of time series forecasting methods to a real-world dataset, highlighting the importance of checking for stationarity, transforming data accordingly, and fitting appropriate models for analysis and forecasting.

Understanding Time Series Forecasting: A Dive into Predictive Analysis

In the realm of data analysis, time series forecasting emerges as a critical tool for predicting future events based on past patterns. But what exactly is time series forecasting, and what type of data is ideal for leveraging its potential? Let’s explore.

What is Time Series Forecasting?

Time series forecasting involves analysing a collection of data points recorded over time, known as a time series, to predict future values. This approach is fundamental in various fields, from economics to environmental science, enabling experts to anticipate trends, seasonal effects, and even irregular patterns in future data.

A time series is essentially a sequence of data points indexed in time order, often with equal intervals between them. This could be anything from daily temperatures to monthly sales figures.

Ideal Data for Time Series Forecasting

The effectiveness of time series forecasting hinges on the nature of the data at hand. The ideal data should have these characteristics:

  1. Time-dependent: The data should inherently depend on time, showing significant variations at different time points.
  2. Consistent frequency: The data points should be recorded at regular intervals – be it hourly, daily, monthly, or annually.
  3. Sufficient historical data: A substantial amount of historical data is crucial to discern patterns and trends.
  4. Clear Trends or Seasonality: Data that exhibits trends (upward or downward movement over time) or seasonality (regular and predictable patterns within a specific time frame) are particularly suited for time series analysis.
  5. Stationarity (or transformed to be so): Ideally, the statistical properties of the series – mean, variance, and autocorrelation – should be constant over time. If not naturally stationary, data can often be transformed to achieve this property, enhancing the forecasting accuracy.

Real-World Application Example

One compelling example is the analysis of police shooting data. This data, indexed by the date of occurrence, exhibits time-dependent characteristics, making it suitable for time series analysis. By analysing the count of such events over time, patterns can be observed and used for forecasting future occurrences.

Conclusion

Time series forecasting stands out as a pivotal technique in data analysis, offering a window into future trends and patterns. Ideal time series data is time-dependent, consistently recorded, and exhibits trends or seasonality.

Decoding Fatal Police Shootings: A Decision Tree Analysis

The Path to Insight through Decision Trees

In the intricate realm of criminal justice data, finding patterns in fatal police shootings is as challenging as it is crucial. A Decision Tree Classifier offers a visual and interpretable approach to machine learning, making it an excellent tool for shedding light on the factors that lead to different manners of death in such incidents.

The Rationale Behind Choosing Decision Trees

Our analytical journey led us to deploy a Decision Tree Classifier for several compelling reasons:

  • Interpretability: Unlike black-box models, decision trees provide clear visualization of the decision-making process.
  • Non-Linearity: Decision Trees can capture non-linear patterns, which are often present in complex datasets.
  • Feature Interaction: They naturally consider the interaction between features without the need for explicit engineering.

The Analytical Process

We embarked on this path with a clear goal: to predict the ‘manner of death’ in police shootings. The dataset was pruned of any missing values, irrelevant identifiers were dropped, and categorical variables were encoded.

Upon training the Decision Tree on the cleansed dataset, it was tested for its predictive prowess.

Unveiling the Results

The Decision Tree Classifier’s performance on the test set revealed a mixed narrative:

  • An impressive overall accuracy of around 90.4% was observed.
  • For the majority class, presumed to be ‘not shot and Tasered’, the model scored high on all fronts—precision, recall, and F1-score each at 95%.
  • For the minority class, presumed to be ‘shot and Tasered’, the model struggled with low precision and recall, both hovering around 15%.

Interpreting the Branches of Our Tree

While the Decision Tree’s high accuracy may seem promising, it is primarily indicative of its strength in predicting the majority class. The relatively low precision and recall for the minority class point to a common issue in data analytics—class imbalance—which can lead to a bias in the model’s predictions.

Recommendations for a Sturdier Tree

In pursuit of a more balanced and robust model, we propose:

  • Balancing the Dataset: Employing techniques like SMOTE for the minority class to improve the model’s sensitivity to less frequent outcomes.
  • Tweaking Tree Complexity: Adjusting the Decision Tree’s depth to prevent overfitting to the majority class.
  • Leveraging Ensemble Methods: Combining the strengths of multiple decision trees through Random Forest or Gradient Boosting may yield a model that is both accurate and generalizable.
  • Cross-validation: Implementing cross-validation techniques to ensure consistent performance across different data segments.
  • Exploring Beyond the Tree: Considering other machine learning models to compare and ensure the best approach is adopted for this analysis.

Conclusion

The Decision Tree Classifier serves as a powerful starting point in the quest to understand the dynamics behind fatal police shootings. While it provides valuable insights into the data, the journey towards a model that treats all classes equitably continues. The steps we take now to refine our model will shape the tools of tomorrow, aiding in policy formulation and training that could save lives.

Navigating the Complexities of Fatal Police Shootings with a Bayesian Machine Learning Approach

The Quest for Clarity in Public Safety Data

In the ever-evolving landscape of data analytics, the quest to understand high-stakes incidents such as fatal police shootings is both a necessity and a challenge. A Bayesian approach to machine learning presents a promising path to unravel the statistical threads that weave through the fabric of such events.

A Dive into Bayesian Inference

Bayesian methods stand out for their rigorous probabilistic interpretation of events. By treating unknown parameters as random variables, Bayesian inference allows us to update our beliefs in light of new evidence. This approach is naturally suited to analyzing events that unfold in the realm of public safety, where uncertainty is a constant companion.

Our Analytical Odyssey with Gaussian Naive Bayes

In the absence of the pgmpy library for constructing complex Bayesian Networks, we turned to the Gaussian Naive Bayes classifier—a simplification of the Bayesian approach that assumes feature independence. Despite its simplicity, this algorithm can be a potent tool when applied with care.

The Why and How

Our objective was clear: to predict the ‘manner of death’ in police shootings using available data features. The Gaussian Naive Bayes classifier was chosen for its ability to handle continuous and categorical data, its computational efficiency, and its foundation in probabilistic reasoning.

The Unveiling of Results

Our model delivered a seemingly impressive 94% accuracy. However, a deeper dive into the classification report revealed a stark dichotomy:

  • For the majority class, we observed high precision and recall.
  • For the minority class, the precision and recall plummeted to 0%, indicating a failure to predict less frequent outcomes.

Interpreting the Bayesian Tale

The high accuracy masks a biased model performance skewed toward the majority class. This is indicative of an underlying class imbalance—a common phenomenon where models are overwhelmed by the majority class and neglect the nuances of less represented classes.

Charting a Course for Equitable Analysis: Recommendations

To steer our model towards a more balanced and equitable analysis, we recommend the following course of action:

  • Embrace Resampling: Applying techniques to balance class representation, such as SMOTE, will allow the minority class to have a more pronounced voice in the model’s learning process.
  • Adopt a Broader Metric View: Moving beyond accuracy, we suggest focusing on the macro-average F1-score to capture a more holistic view of the model’s performance across all classes.
  • Invoke Cost-sensitive Learning: By incorporating the real-world costs of misclassification, we can align the model’s incentives with the goal of equitable performance across classes.

The Beacon Ahead

The Gaussian Naive Bayes model, with its Bayesian foundations, has laid the groundwork for a nuanced understanding of fatal police shootings. As we refine our approach, balancing the dataset, and enhancing our evaluation metrics, we move closer to a tool that can inform policy, guide training, and ultimately, contribute to the safety and fairness of law enforcement practices.

In Conclusion

The Bayesian machine learning approach provides a statistical compass to navigate the complexities of public safety data. While the journey to a perfectly balanced model continues, the strides made thus far illuminate the path toward more informed decision-making in the realm of public safety.

Unveiling Patterns in Fatal Police Shootings: Insights from Artificial Neural Networks

Introduction

The application of Artificial Neural Networks (ANNs) in understanding complex societal issues has been gaining momentum. One such challenging area is the analysis of fatal police shootings. By employing ANNs, we aim to unravel the intricate patterns that could explain the dynamics behind these critical incidents.

Methodology

Our study utilizes a robust dataset encompassing various attributes of fatal police shooting incidents, such as demographics, the armed status of the individual, and whether signs of mental illness were evident. We trained an ANN with a single hidden layer of 50 neurons, using a split of 80% training data and 20% test data.

Results

The ANN model’s performance on the test set yielded an accuracy of 67%, showing promise in its predictive capabilities. However, it’s clear that the model has a stronger grasp on incidents classified as ‘Attack’, as opposed to ‘Other’ threat levels:

  • ‘Other’ Threat Levels:
    • Precision: 57%
    • Recall: 44%
    • F1-Score: 50%
  • ‘Attack’ Threat Levels:
    • Precision: 71%
    • Recall: 80%
    • F1-Score: 75%

These results suggest that while the ANN can reasonably identify ‘Attack’ incidents, there’s substantial room for improvement, particularly in correctly classifying ‘Other’ threat levels.

Analysis

The disparity in the model’s ability to predict different threat levels points to potential areas of focus for future model refinement. The lower precision and recall for ‘Other’ threat levels indicate the model’s difficulty in generalizing the characteristics that distinguish these incidents.

Recommendations for Improvement

  • Network Architecture: Experimenting with additional hidden layers or adjusting the number of neurons could enhance the model’s learning capacity.
  • Class Imbalance: Strategies such as oversampling the minority class could help the ANN learn more about underrepresented patterns.
  • Hyperparameter Tuning: A systematic search for the best hyperparameters may optimize the model’s performance.
  • Feature Engineering: Improved feature selection could reduce noise and focus the ANN’s learning on the most predictive attributes.
  • Model Interpretation: Tools that illuminate the ANN’s decision-making could provide actionable insights and bolster trust in its predictions.