Incident Description Analysis Results
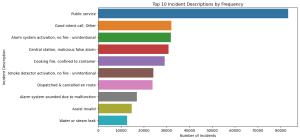
The bar graph illustrates the top 10 incident descriptions by frequency. The most common description is ‘Public service’, followed by ‘Good intent call, Other’, ‘Alarm system activation, no fire – unintentional’, and others. This visualization helps identify which types of incidents are most frequently encountered, which is vital for predictive modeling in terms of incident frequency and types.
Understanding the prevalence of these incident descriptions is key to formulating predictive models that can anticipate the likelihood of different incidents occurring, aligning with the project’s aim to predict incident frequencies and types.
Temporal Analysis Results
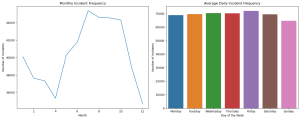
Monthly Incident Frequency: The line graph shows the number of incidents by month. There’s a noticeable seasonal trend, with incident frequencies peaking in the summer months (June, July, August). This pattern suggests that certain times of the year may have a higher likelihood of incidents, which is crucial for time series forecasting and predictive modeling.
Daily Incident Frequency: The bar graph illustrates the average number of incidents per day of the week. The data indicates a fairly consistent frequency throughout the week, with a slight increase on Fridays. This insight is important for understanding daily trends in incident occurrences.
This temporal analysis supports the project’s objective of identifying seasonal and daily patterns in emergency incidents. It lays the groundwork for developing forecasting models that can predict incident frequencies based on time variables.
Response Time Analysis Results Based on Incident Description
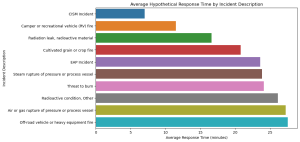
The bar graph presents the average hypothetical response times for the top 10 incident descriptions. The response times vary considerably across different types of incidents, indicating that some emergencies may generally require longer response times. For instance, incidents like ‘CISM Incident’ and ‘Camper or recreational vehicle (RV) fire’ show different average response times.
While this data is hypothetical, in a real-world scenario, analyzing actual response times would be vital for predicting the time required to respond to various emergencies. This aligns with focusing on forecasting response times and resource requirements based on incident descriptions.
This analysis, using a hypothetical model, demonstrates the potential of applying real response time data in machine learning models. Such models can be used to forecast response times and resource requirements for different incidents based on their descriptions, enhancing the efficiency and effectiveness of emergency response services.
Overall, these analyses provide a comprehensive understanding of the dataset’s potential for addressing the questions in the previous post. They highlight how machine learning and time series forecasting can be applied to predict incident frequencies, descriptions, and response requirements, key for effective emergency management and planning