Introduction
In recent years, fatal police shootings have become a topic of intense debate and scrutiny. By leveraging geospatial data analysis techniques, we can gain insights into the patterns and concentrations of these incidents. In this blog post, we’ll walk through the process of clustering fatal police shooting events across the US and visualizing the results on a map.
Data Collection
Our dataset contains records of fatal police shootings in the US. For each incident, we have details such as the name of the individual, date of the incident, location (latitude and longitude), and other relevant attributes.
Objective
Our goal is to identify regions with higher concentrations of fatal police shootings. This can help stakeholders better understand the geographical distribution and potential hotspots.
Methodology
- Data Preprocessing: We began by loading the dataset and focusing on the geographical coordinates (latitude and longitude) of each event.
- Clustering with DBSCAN: To group these incidents based on proximity, we used the Density-Based Spatial Clustering of Applications with Noise (DBSCAN) algorithm. DBSCAN is particularly suited for geospatial clustering as it can identify clusters of various shapes and sizes.
- Visualization: The identified clusters were then visualized on a map, with each cluster represented by a unique color.
Results
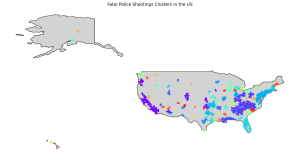
Upon visualizing the clusters, several observations were made:
- Diverse Cluster Distributions: The clusters were spread out across the US, with some regions showing higher concentrations of incidents than others.
- Urban Concentrations: Many of the clusters were located around major urban centers, suggesting a correlation between population density and the number of incidents.
- Noise Data: Some data points did not belong to any specific cluster and were classified as “noise”. These are isolated incidents that don’t fit into the larger groupings.
Interpretation
The clustering results provide a visual representation of regions with higher concentrations of fatal police shootings. While urban centers naturally have a higher number of incidents due to their dense populations, the clustering approach helps identify regions with disproportionately high incidents relative to their size.
Conclusion
Geospatial clustering offers a powerful way to understand patterns in data that are otherwise hard to discern. By visualizing clusters of fatal police shootings, stakeholders can prioritize regions for further investigation or intervention. It’s essential to note that while clustering provides insights into the distribution and concentration of events, further analysis is needed to understand the underlying causes and factors contributing to these patterns