Decoding Fatal Police Shootings: A Decision Tree Analysis

The Path to Insight through Decision Trees

In the intricate realm of criminal justice data, finding patterns in fatal police shootings is as challenging as it is crucial. A Decision Tree Classifier offers a visual and interpretable approach to machine learning, making it an excellent tool for shedding light on the factors that lead to different manners of death in such incidents.

The Rationale Behind Choosing Decision Trees

Our analytical journey led us to deploy a Decision Tree Classifier for several compelling reasons:

  • Interpretability: Unlike black-box models, decision trees provide clear visualization of the decision-making process.
  • Non-Linearity: Decision Trees can capture non-linear patterns, which are often present in complex datasets.
  • Feature Interaction: They naturally consider the interaction between features without the need for explicit engineering.

The Analytical Process

We embarked on this path with a clear goal: to predict the ‘manner of death’ in police shootings. The dataset was pruned of any missing values, irrelevant identifiers were dropped, and categorical variables were encoded.

Upon training the Decision Tree on the cleansed dataset, it was tested for its predictive prowess.

Unveiling the Results

The Decision Tree Classifier’s performance on the test set revealed a mixed narrative:

  • An impressive overall accuracy of around 90.4% was observed.
  • For the majority class, presumed to be ‘not shot and Tasered’, the model scored high on all fronts—precision, recall, and F1-score each at 95%.
  • For the minority class, presumed to be ‘shot and Tasered’, the model struggled with low precision and recall, both hovering around 15%.

Interpreting the Branches of Our Tree

While the Decision Tree’s high accuracy may seem promising, it is primarily indicative of its strength in predicting the majority class. The relatively low precision and recall for the minority class point to a common issue in data analytics—class imbalance—which can lead to a bias in the model’s predictions.

Recommendations for a Sturdier Tree

In pursuit of a more balanced and robust model, we propose:

  • Balancing the Dataset: Employing techniques like SMOTE for the minority class to improve the model’s sensitivity to less frequent outcomes.
  • Tweaking Tree Complexity: Adjusting the Decision Tree’s depth to prevent overfitting to the majority class.
  • Leveraging Ensemble Methods: Combining the strengths of multiple decision trees through Random Forest or Gradient Boosting may yield a model that is both accurate and generalizable.
  • Cross-validation: Implementing cross-validation techniques to ensure consistent performance across different data segments.
  • Exploring Beyond the Tree: Considering other machine learning models to compare and ensure the best approach is adopted for this analysis.

Conclusion

The Decision Tree Classifier serves as a powerful starting point in the quest to understand the dynamics behind fatal police shootings. While it provides valuable insights into the data, the journey towards a model that treats all classes equitably continues. The steps we take now to refine our model will shape the tools of tomorrow, aiding in policy formulation and training that could save lives.
Navigating the Complexities of Fatal Police Shootings with a Bayesian Machine Learning Approach

The Quest for Clarity in Public Safety Data

In the ever-evolving landscape of data analytics, the quest to understand high-stakes incidents such as fatal police shootings is both a necessity and a challenge. A Bayesian approach to machine learning presents a promising path to unravel the statistical threads that weave through the fabric of such events.

A Dive into Bayesian Inference

Bayesian methods stand out for their rigorous probabilistic interpretation of events. By treating unknown parameters as random variables, Bayesian inference allows us to update our beliefs in light of new evidence. This approach is naturally suited to analyzing events that unfold in the realm of public safety, where uncertainty is a constant companion.

Our Analytical Odyssey with Gaussian Naive Bayes

In the absence of the pgmpy library for constructing complex Bayesian Networks, we turned to the Gaussian Naive Bayes classifier—a simplification of the Bayesian approach that assumes feature independence. Despite its simplicity, this algorithm can be a potent tool when applied with care.

The Why and How

Our objective was clear: to predict the ‘manner of death’ in police shootings using available data features. The Gaussian Naive Bayes classifier was chosen for its ability to handle continuous and categorical data, its computational efficiency, and its foundation in probabilistic reasoning.

The Unveiling of Results

Our model delivered a seemingly impressive 94% accuracy. However, a deeper dive into the classification report revealed a stark dichotomy:

  • For the majority class, we observed high precision and recall.
  • For the minority class, the precision and recall plummeted to 0%, indicating a failure to predict less frequent outcomes.

Interpreting the Bayesian Tale

The high accuracy masks a biased model performance skewed toward the majority class. This is indicative of an underlying class imbalance—a common phenomenon where models are overwhelmed by the majority class and neglect the nuances of less represented classes.

Charting a Course for Equitable Analysis: Recommendations

To steer our model towards a more balanced and equitable analysis, we recommend the following course of action:

  • Embrace Resampling: Applying techniques to balance class representation, such as SMOTE, will allow the minority class to have a more pronounced voice in the model’s learning process.
  • Adopt a Broader Metric View: Moving beyond accuracy, we suggest focusing on the macro-average F1-score to capture a more holistic view of the model’s performance across all classes.
  • Invoke Cost-sensitive Learning: By incorporating the real-world costs of misclassification, we can align the model’s incentives with the goal of equitable performance across classes.

The Beacon Ahead

The Gaussian Naive Bayes model, with its Bayesian foundations, has laid the groundwork for a nuanced understanding of fatal police shootings. As we refine our approach, balancing the dataset, and enhancing our evaluation metrics, we move closer to a tool that can inform policy, guide training, and ultimately, contribute to the safety and fairness of law enforcement practices.

In Conclusion

The Bayesian machine learning approach provides a statistical compass to navigate the complexities of public safety data. While the journey to a perfectly balanced model continues, the strides made thus far illuminate the path toward more informed decision-making in the realm of public safety.

Unveiling Patterns in Fatal Police Shootings: Insights from Artificial Neural Networks

Introduction

The application of Artificial Neural Networks (ANNs) in understanding complex societal issues has been gaining momentum. One such challenging area is the analysis of fatal police shootings. By employing ANNs, we aim to unravel the intricate patterns that could explain the dynamics behind these critical incidents.

Methodology

Our study utilizes a robust dataset encompassing various attributes of fatal police shooting incidents, such as demographics, the armed status of the individual, and whether signs of mental illness were evident. We trained an ANN with a single hidden layer of 50 neurons, using a split of 80% training data and 20% test data.

Results

The ANN model’s performance on the test set yielded an accuracy of 67%, showing promise in its predictive capabilities. However, it’s clear that the model has a stronger grasp on incidents classified as ‘Attack’, as opposed to ‘Other’ threat levels:

  • ‘Other’ Threat Levels:
    • Precision: 57%
    • Recall: 44%
    • F1-Score: 50%
  • ‘Attack’ Threat Levels:
    • Precision: 71%
    • Recall: 80%
    • F1-Score: 75%

These results suggest that while the ANN can reasonably identify ‘Attack’ incidents, there’s substantial room for improvement, particularly in correctly classifying ‘Other’ threat levels.

Analysis

The disparity in the model’s ability to predict different threat levels points to potential areas of focus for future model refinement. The lower precision and recall for ‘Other’ threat levels indicate the model’s difficulty in generalizing the characteristics that distinguish these incidents.

Recommendations for Improvement

  • Network Architecture: Experimenting with additional hidden layers or adjusting the number of neurons could enhance the model’s learning capacity.
  • Class Imbalance: Strategies such as oversampling the minority class could help the ANN learn more about underrepresented patterns.
  • Hyperparameter Tuning: A systematic search for the best hyperparameters may optimize the model’s performance.
  • Feature Engineering: Improved feature selection could reduce noise and focus the ANN’s learning on the most predictive attributes.
  • Model Interpretation: Tools that illuminate the ANN’s decision-making could provide actionable insights and bolster trust in its predictions.

Geographical Insights into Police Shootings: An Age and Race Perspective

Introduction:

In recent years, the topic of police shootings has gained significant attention both in media and academic circles. While numerous studies have approached this issue from various angles, understanding the geographical distribution in conjunction with age and race provides a more comprehensive perspective. In this blog post, we dive deep into this aspect, employing advanced data analysis techniques to unearth patterns and draw meaningful conclusions.

Methodology:

We utilised a dataset detailing police shootings across North America. Our primary focus was on the geographical coordinates (latitude and longitude), age, and race of the individuals involved.

  • Descriptive Statistics:
    • Age: The average age of individuals involved was 36.7 years, with a median of 35 years. The youngest individual was 6 years old, while the oldest was 91.
    • Race Distribution:
      • White (W): 50.9%
      • Black (B): 27.0%
      • Hispanic (H): 18.2%
      • Asian (A): 2.0%
      • Native American (N): 1.6%
      • Other (O): 0.3%
  • Geographical Analysis using DBSCAN Clustering: We employed the DBSCAN clustering algorithm to identify regions with high concentrations of police shootings. This algorithm grouped the data into 4 distinct clusters.

Visualisation and Insights:

Using GEOPANDAS, we visualised these clusters on a map:

  1. The map clearly highlighted regions with higher densities of police shootings.
  2. Each data point’s size was proportional to the age of the individual, and colour coded based on the cluster they belonged to.
  3. White (W) and Black (B) individuals were prominently represented across the geographical span.
  4. Hispanic (H) individuals were also notably present, especially in regions with higher longitude values.
  5. The size of the data points indicated that younger individuals (especially in the Black and Hispanic categories) were more commonly involved in police shootings in certain regions.

  • Yellow (A): Asian
  • Blue (W): White
  • Red (H): Hispanic
  • Green (B): Black
  • Purple (O): Other
  • Orange (N): Native American

The size of each data point corresponds to the age of the individual involved in the shooting. Larger points indicate older individuals, while smaller points denote younger ones.

Conclusions:

  • Geographical Hotspots: Certain regions showed a higher concentration of police shootings, highlighting potential areas of concern 
  • Racial Disparities: The significant representation of White and Black individuals across many regions emphasises the need for further analysis into the racial aspects 
  • Age-Related Trends: The visualisation underscored that younger individuals, especially from the Black and Hispanic communities, were more commonly involved in these incidents in specific regions.

A Comprehensive Breakdown: Age, Race, and Gender in Police Shootings

Introduction:
In an era where societal issues are under intense scrutiny, understanding the demographics of those affected by police shootings is paramount. This analysis provides a granular look into the interplay of age, race, and gender in police shootings, revealing some critical patterns and implications.

Breakdown by Age and Race:
When examining the age distribution across races:
Black Individuals: The median age was 31, with males having a right-skewed distribution around the late 20s and females around the early 30s.
Hispanic Individuals: The median age was 32 for males and 30 for females, both showing a right-skewed distribution.
White Individuals: Males had a median age of 38, while females had a median age of 39, both with a slightly right-skewed distribution.
Asian Individuals: Males had a median age of 34, while the smaller female sample had a median age of 47.

Breakdown by Race and Gender:
Males overwhelmingly dominate the dataset across all racial categories, accounting for about 95% of the total. However,
White and Black Categories: Both races had relatively higher female representations, with females accounting for approximately 5% of the total in these categories.
Other Racial Categories: Female representation was significantly smaller, due to smaller sample sizes.

Breakdown by Gender Alone:
Across all racial backgrounds:
– Males accounted for a staggering 95% of the dataset.
– Females, representing 5% of the dataset, were especially prevalent within the White (189 individuals) and Black (58 individuals) categories.

 Conclusions Drawn:
1. Age Discrepancies: The age distributions indicate that Black and Hispanic individuals involved in police shootings tend to be younger. The reasons behind this trend warrant further investigation.
2. Gender Disparity: Males significantly outnumber females in all racial categories, but the presence of females, especially in the White and Black categories, is noteworthy.
3. Implications for Policy and Research: The observed patterns emphasise the importance of understanding the underlying socio-economic, geographic, and situational factors. Such insights can guide more informed policy decisions and further research endeavours.

Fatal Police Shootings Analysis

Introduction

The dataset provides information on fatal police shootings in the US. This report outlines the results of three machine learning classification tasks performed on the dataset: predicting the manner of death, predicting the perceived threat level, and predicting whether a body camera was active during the incident.

Task 1: Predict manner_of_death

Features used: armed, age, race, threat_level, and signs_of_mental_illness.

Accuracy: 0.94

Classification Report:
precision    recall  f1-score   support

0       0.95      0.99      0.97      1171
1       0.08      0.02      0.03        60


Feature Importance


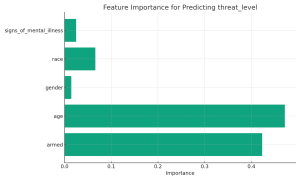
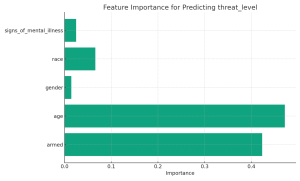
Task 2: Predict threat_level

Features used: armed, age, gender, race, and signs_of_mental_illness.

Accuracy: 0.66

Classification Report:
precision    recall  f1-score   support

0       0.71      0.83      0.76       772
1       0.54      0.38      0.45       418
2       0.42      0.25      0.31        40

Feature Importance:


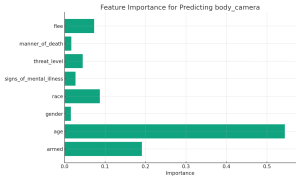
Task 3: Predict body_camera

Features used: armed, age, gender, race, threat_level, manner_of_death, and flee.

Accuracy: 0.80

Classification Report:
precision    recall  f1-score   support

False       0.86      0.92      0.89       961
True       0.14      0.08      0.10       160

Feature Importance:


Insights

  1. Age consistently appears as a significant factor across all tasks. This suggests that the age of the individual involved plays a crucial role in various aspects of police encounters.
    2. The perceived threat level is influential in both predicting the manner_of_death and whether a body_camera was active. This highlights the importance of the perceived threat in police encounters.
    3. Armed status also has a notable influence across all tasks, emphasizing the role weapons play in these situations.
    4. Features like race, while not the most influential, still play a notable role in certain tasks. This may hint towards societal or systemic factors at play.
    5. The use of a body camera appears to be influenced by various factors, including the perceived threat, age, and race. This suggests that the decision to activate a body camera (or the scenarios where it’s active) may not be entirely random.

Clustering Techniques: Understanding and Application to Police Shootings Data

1. K-Means Clustering

Suitability:

Given the numeric nature of attributes like age, longitude, and latitude, K-Means can be applied to cluster based on geolocation or age groups.

Advantages:

  • Efficient for large datasets.
  • Can quickly identify patterns when the number of clusters is known or can be estimated.

Limitations:

  • Assumes clusters to be spherical, which might not be suitable for complex geographic distributions.
  • Requires the number of clusters to be specified, which might be challenging without domain knowledge.

2. Hierarchical Clustering

Suitability:

Could be used to build a hierarchical structure of incidents based on similarity in attributes, such as geolocation or threat level.

Advantages:

  • Can provide a hierarchy of incidents, offering a graded perspective.
  • Doesn’t require a pre-specified number of clusters.

Limitations:

  • Computationally expensive for large datasets, which might make it less suitable for this dataset if it’s extensive.

3. DBSCAN

Suitability:

Given the geographic attributes (longitude and latitude), DBSCAN can identify dense regions of incidents, which could be cities or neighborhoods with high shooting incidents, and separate them from sparse regions.

Advantages:

  • Can identify clusters of varying shapes and densities, making it suitable for geographic data.
  • Doesn’t require the number of clusters to be specified.

Limitations:

  • May struggle if the density variation between different cities or neighborhoods is vast.

4. Mean Shift Clustering

Suitability:

For attributes like geolocation, Mean Shift could identify clusters without making any assumptions about their shapes.

Advantages:

  • Can detect clusters of any shape, suitable for geospatial clustering.
  • No prior knowledge of the number of clusters needed.

Limitations:

  • Computationally intensive, which might be a concern for large datasets.
  • The bandwidth parameter needs careful tuning.

Conclusion

The choice of clustering method for the fatal police shootings dataset largely depends on the objective. For geospatial patterns, DBSCAN and Mean Shift seem promising due to their ability to handle clusters of varying shapes and densities. K-Means could be a quick way to get insights if the number of clusters is known or can be estimated, while hierarchical clustering could provide a structured breakdown of incidents.

Always remember to preprocess the data, handle missing values, and consider feature scaling or transformation to improve clustering results.

Analyzing Racial Bias in Fatal Police Shootings Using Data Clustering

Fatal police shootings have been a point of contention and debate, particularly in the context of potential racial biases. In this blog, we’ll dive into a dataset that records such incidents to see if any patterns emerge.

Dataset Overview:

The dataset contains information on fatal police shootings, including details such as the individual’s race, age, threat level, and whether a body camera was present during the incident.

Key Findings:

  1. Body Camera Presence by Race:
    • Asian and Black individuals had the highest percentages (around 20%) of incidents where body cameras were present.
    • White individuals and those of “Other” racial categories had the lowest percentages, below 12%.
  2. Clustering by Race:
    • When clustering the data solely based on race, the clusters predominantly grouped incidents by specific racial groups, such as Black, White, Hispanic, Asian, and Native American.
  3. Body Camera Filter’s Impact:
    • Filtering the data for incidents with body cameras and then clustering based on race revealed that the racial distribution of incidents with body cameras aligns with the overall racial distribution in the dataset.

Insights and Implications:

  • The racial distribution of incidents with body cameras closely follows the overall racial distribution in the dataset. This might suggest that body camera usage is consistent across racial groups, although external factors, such as departmental policies, can influence this.
  • Clustering based on race showed clear racial groupings, indicating that the dataset has a distinct racial distribution of incidents. However, determining racial bias requires a more in-depth analysis, taking into account population distributions, socio-economic factors, and other contextual data.
  • While the presence or absence of body cameras doesn’t significantly alter the racial distribution of fatal police shootings, their presence can be vital for transparency, accountability, and building public trust.

Concluding Thoughts:

Data can provide valuable insights into complex issues like fatal police shootings. While our analysis offers an initial glimpse into patterns within the dataset, it’s crucial to approach the topic with a comprehensive perspective, considering all influencing factors.

Understanding potential biases in such incidents is essential for informed public discourse, creating effective policies, and ensuring justice and equity.

Exploring Fatal Police Shootings in the US Using Geospatial Clustering

Introduction

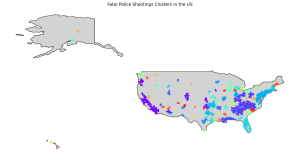
In recent years, fatal police shootings have become a topic of intense debate and scrutiny. By leveraging geospatial data analysis techniques, we can gain insights into the patterns and concentrations of these incidents. In this blog post, we’ll walk through the process of clustering fatal police shooting events across the US and visualizing the results on a map.

Data Collection

Our dataset contains records of fatal police shootings in the US. For each incident, we have details such as the name of the individual, date of the incident, location (latitude and longitude), and other relevant attributes.

Objective

Our goal is to identify regions with higher concentrations of fatal police shootings. This can help stakeholders better understand the geographical distribution and potential hotspots.

Methodology

  1. Data Preprocessing: We began by loading the dataset and focusing on the geographical coordinates (latitude and longitude) of each event.
  2. Clustering with DBSCAN: To group these incidents based on proximity, we used the Density-Based Spatial Clustering of Applications with Noise (DBSCAN) algorithm. DBSCAN is particularly suited for geospatial clustering as it can identify clusters of various shapes and sizes.
  3. Visualization: The identified clusters were then visualized on a map, with each cluster represented by a unique color.

Results

Upon visualizing the clusters, several observations were made:

  1. Diverse Cluster Distributions: The clusters were spread out across the US, with some regions showing higher concentrations of incidents than others.
  2. Urban Concentrations: Many of the clusters were located around major urban centers, suggesting a correlation between population density and the number of incidents.
  3. Noise Data: Some data points did not belong to any specific cluster and were classified as “noise”. These are isolated incidents that don’t fit into the larger groupings.

Interpretation

The clustering results provide a visual representation of regions with higher concentrations of fatal police shootings. While urban centers naturally have a higher number of incidents due to their dense populations, the clustering approach helps identify regions with disproportionately high incidents relative to their size.

Conclusion

Geospatial clustering offers a powerful way to understand patterns in data that are otherwise hard to discern. By visualizing clusters of fatal police shootings, stakeholders can prioritize regions for further investigation or intervention. It’s essential to note that while clustering provides insights into the distribution and concentration of events, further analysis is needed to understand the underlying causes and factors contributing to these patterns


Clustering Police Shootings Data: A Deeper Dive

What’s Clustering?

Imagine you’ve dumped legos, toy cars, and action figures into a giant toy box. Now, you want to organize them. You’d naturally group similar toys together, right? That’s essentially what clustering does for data. It’s like a detective trying to group similar cases together without having any labels to guide them through it

Why K-Means?

There are many clustering methods out there, so why choose K-Means? K-Means is one of the simplest and most popular clustering techniques. It’s like trying to find centers in our candy analogy: the candies closest to a center (in terms of flavour) are grouped together. In K-Means, these centers are called “centroids”. The algorithm tries to find the best centroids such that the distance between the datapoints in a cluster and its centroid is minimised.

Digging into the Data

We dove into the police shootings data with a mission: to see if there were any hidden patterns. Using the K-Means clustering method, we grouped the data based on age, gender, race, and signs of mental illness. The outcome? Three distinct clusters:

  • Cluster 0: 1583 incidents
  • Cluster 1: 6014 incidents
  • Cluster 2: 361 incidents

Interpreting the Clusters

  • Cluster 0 (1583 incidents): Without diving deep into the data, it’s hard to give a precise interpretation. However, this could represent incidents involving a particular age group, gender, or race. It might also highlight incidents where signs of mental illness were apparent.
  • Cluster 1 (6014 incidents): Being the largest cluster, this might represent the most “common” type of incident based on the features chosen. It could be incidents involving a dominant age group or gender, for instance.
  • Cluster 2 (361 incidents): This being the smallest cluster could indicate rare cases or outliers. For example, it might represent incidents involving older age groups or a particular combination of features.

Potential Implications

Understanding these clusters can shed light on potential biases or patterns in police shootings. For instance, if one cluster predominantly represents a specific racial group, it could indicate a bias that needs further investigation. On the other hand, if a cluster shows a high prevalence of signs of mental illness, it could point towards the need for better mental health interventions and training for law enforcement officers.